Registration report
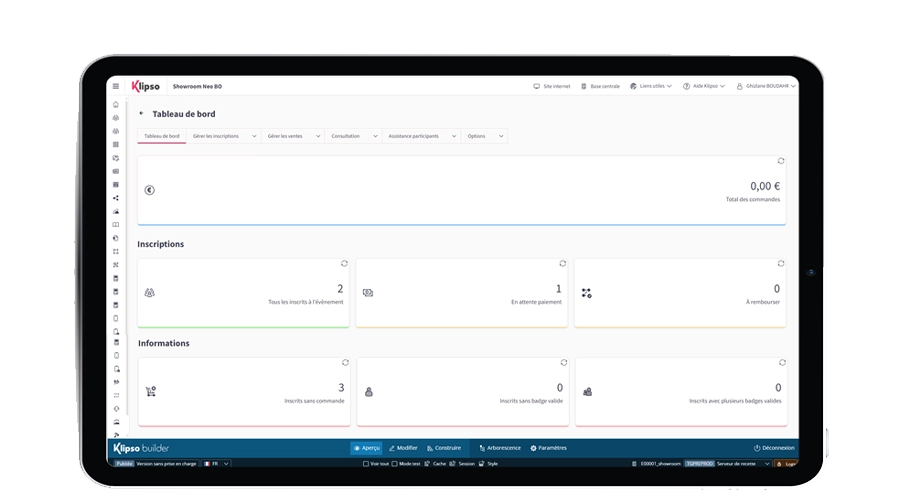
When organizing an event, keeping an eye on the number of registrations is crucial for assessing its success and making any necessary adjustments. By tracking registration numbers, you can make informed decisions about the size of the venue, catering requirements, and staffing needs. To help with this task, event organizers can use registration software that allows them to monitor the number of registrations in real-time.
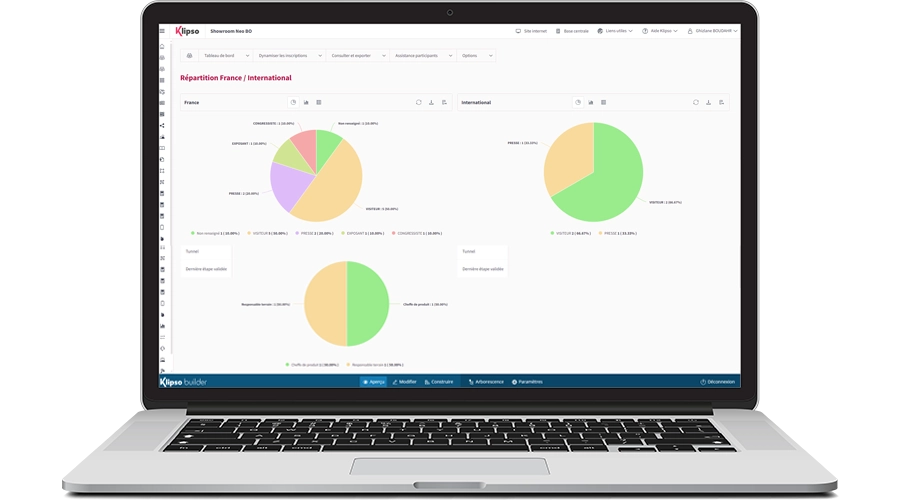
One useful feature of registration report is the ability to visualize the situation of your accounts. This means that you can see a graphical representation of the number of registrations over time, giving you a clear picture of how your event is performing. By visualizing the situation of your accounts, you can stay informed of the daily evolution of your event and make adjustments as needed.
For example, if you notice that registration numbers are lagging, you may need to increase your promotional efforts or offer additional incentives to encourage people to attend. On the other hand, if registrations are higher than expected, you may need to adjust your catering and staffing plans to accommodate the larger number of attendees.
By using Klipso report you can make data-driven decisions that help ensure the success of your event. By staying informed of the daily evolution of your event, you can respond quickly to any changes in registration numbers and take proactive steps to ensure that your event is a success.
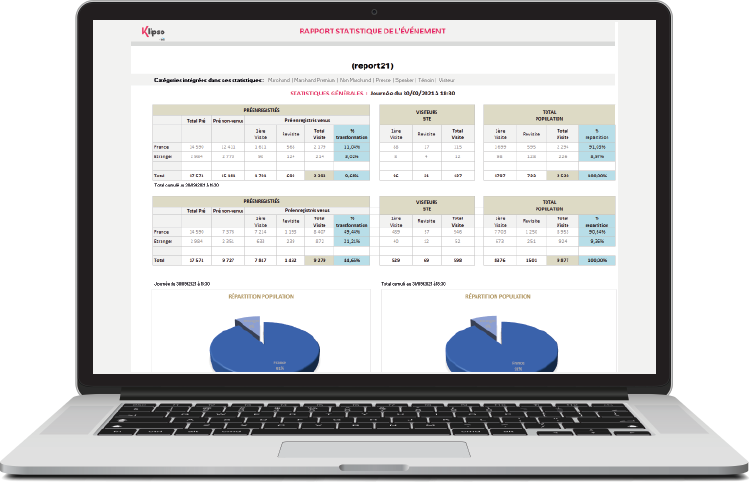
Badge scan report
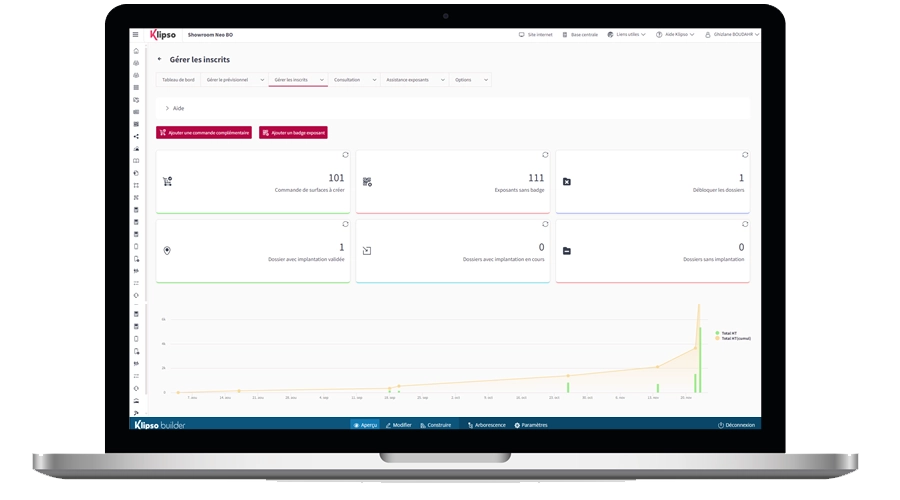
In today’s fast-paced world, organizing events can be a challenging task. One of the most important aspects of event management is keeping track of attendees’ registration status. This is where scan reports come in handy.
Scan reports provide organizers with valuable information on the daily registration status of their hybrid and onsite events. They contain a wealth of information, including the number of attendees, their names, their affiliations, and the time and location of their registration.
These reports can be used to track attendance rates and gauge the success of an event. By monitoring the registration status of an event on a daily basis, organizers can quickly identify any issues that may arise and take appropriate action to address them.
Scan reports are also useful for post-event analysis. By reviewing the data contained in these reports, organizers can identify areas of improvement for future events. For example, if they notice a drop in attendance on a particular day, they can analyze the reasons behind it and take steps to address the issues for the next event.
Networking and matchmaking reports
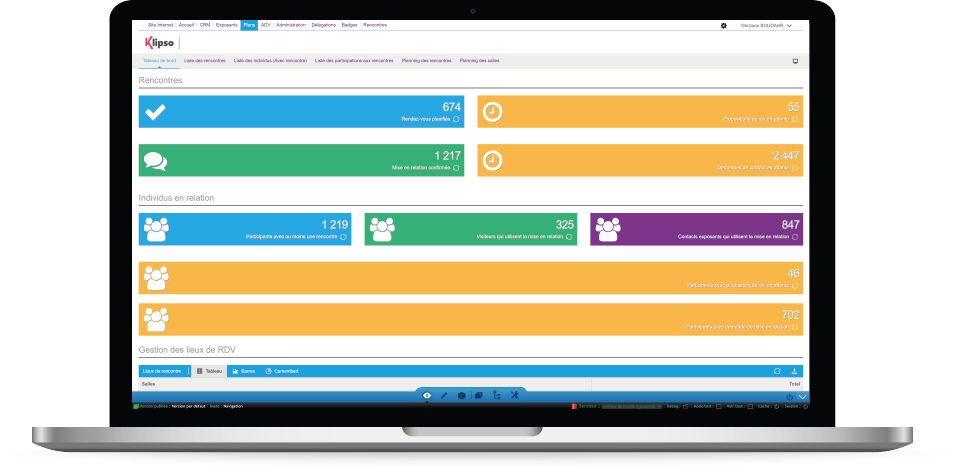
Networking is an important part of many events, and as an organizer, it’s important to have a clear understanding of the networking situation during your event. This includes tracking the number of relationships that have been created, the number of current meetings, and other important networking metrics.
Klipso networking and matchmaking reports allow you to monitor the status of the networking situation in real-time, directly from the organizer space. You can view data such as the number of attendees who have created a profile, the number of matches and meetings that have been scheduled, and the overall engagement level of attendees.
By analyzing this data, you can make informed decisions about how to improve the networking experience for your attendees. For example, if you notice that the number of matches or meetings is low, you might consider promoting networking opportunities more aggressively or offering incentives for attendees to connect with one another.
In addition to monitoring the overall status of the networking situation, it’s also important to track individual attendees and their engagement levels. By tracking individual attendees, you can identify those who may need extra support or encouragement to participate in networking activities. You can also use this data to identify attendees who are highly engaged and likely to be valuable connections for other attendees.
Overall, tracking the networking situation during your event is crucial for ensuring that attendees have a positive experience and are able to connect with each other in meaningful ways. By using networking software or tools, you can monitor the situation in real-time, analyze the data, and make informed decisions to improve the networking experience for everyone involved.
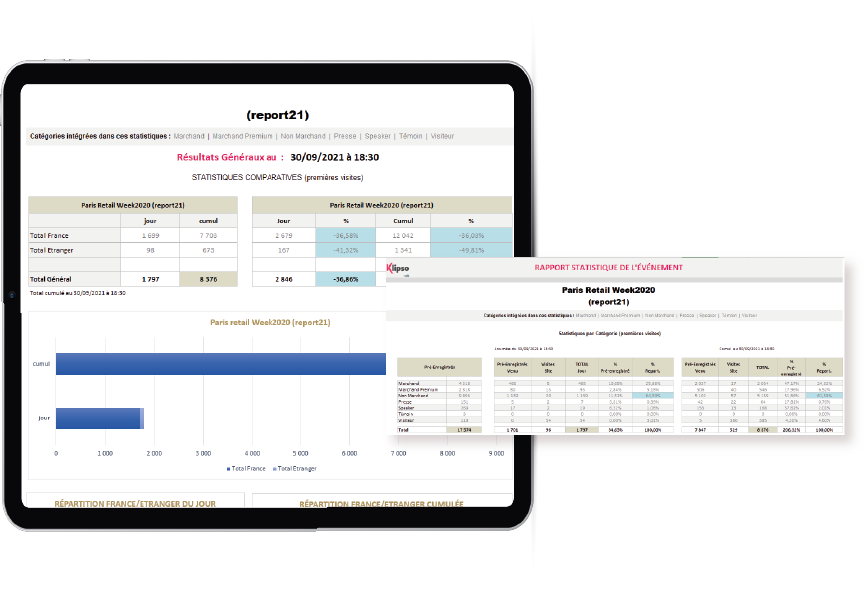
Conversion rate
When it comes to measuring the success of your event, conversion rate is an important metric to track. Conversion rate is the ratio of the number of pre-registrations who attended your event to the number of pre-registrations who did not attend. This metric gives you insight into how successful you were at converting potential attendees into actual attendees.
For example, if you had 500 pre-registrations for your event and 400 of those attendees actually attended, your conversion rate would be 80%.
It’s important to note that conversion rate can vary widely depending on the type of event you’re organizing and the audience you’re targeting. For some events, a high conversion rate might be 50% or more, while for others, a conversion rate of 10-20% might be considered good.
In addition to tracking your overall conversion rate, it’s also useful to track conversion rates for first-time visitors and repeat visitors. First-time visitors are those who have never attended your event before, while repeat visitors are those who have attended your event in the past.
By tracking conversion rates for these two groups separately, you can gain insight into how effective your marketing and outreach efforts are at attracting new attendees, as well as how successful you are at retaining existing attendees. This information can help you make informed decisions about future events and marketing campaigns.
Filters and categories
Consult your report and display by category (premium, gold…), or by type of visitor (speaker, press…). You can also filter by country, date, etc.” This statement refers to the ability to sort and filter data within a report or dataset, allowing users to view the information in a way that is most meaningful to them.
By category refers to grouping the data based on a specific attribute or characteristic. For example, in a customer database, categories may include premium, gold, or silver members, each with their own specific set of features and benefits. By sorting and displaying this data by category, businesses can gain insights into the behavior and preferences of their most valuable customers.
Similarly, sorting and displaying data by type of visitor can provide valuable insights into the effectiveness of marketing and promotional efforts. By identifying which types of visitors are most engaged with a product or service, businesses can better target their marketing efforts and tailor their messaging to the specific needs and interests of their audience.
Filtering by country, date, or other variables allows users to view only the data that is most relevant to their needs. For example, if a business is looking to expand into a new market, they may want to filter their customer database by country to identify trends and patterns in customer behavior and preferences. Similarly, filtering by date can provide insights into seasonal trends or changes in customer behavior over time.
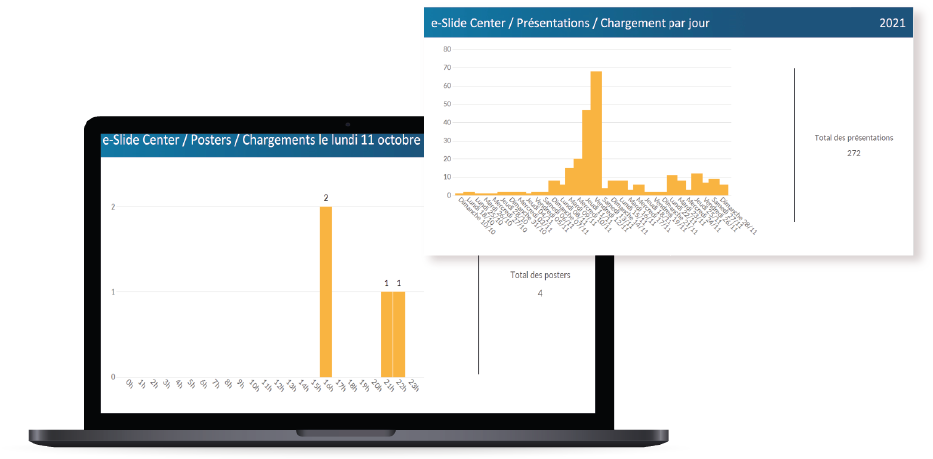
E-posters and display reports
Poster and e-poster presentations are an important part of many events, and as an organizer, it’s crucial to have a clear understanding of when these presentations are being uploaded and how they are being received by attendees. By tracking the time of the biggest upload peak and getting daily reports on the uploading of presentations and connections to the platform, you can ensure that everything is running smoothly and that attendees are able to access the content they need.
Klipso’s e-posters reports allow you to monitor the uploading of presentations in real-time, directly from the organizer space. You can view data such as the number of presentations that have been uploaded, the time of day when the most uploads occur, and the overall engagement level of attendees with these presentations.
By analyzing this data, you can make informed decisions about how to improve the poster and e-poster presentation experience for your attendees. For example, if you notice that the biggest upload peak is occurring at a specific time of day, you might consider adjusting your event schedule to ensure that attendees have enough time to upload their presentations without feeling rushed.
In addition to monitoring the uploading of presentations, it’s also important to track the connections to the platform per day. By tracking the number of attendees who are accessing the platform each day, you can identify trends in attendance and engagement, and make informed decisions about how to improve the overall experience for everyone involved.
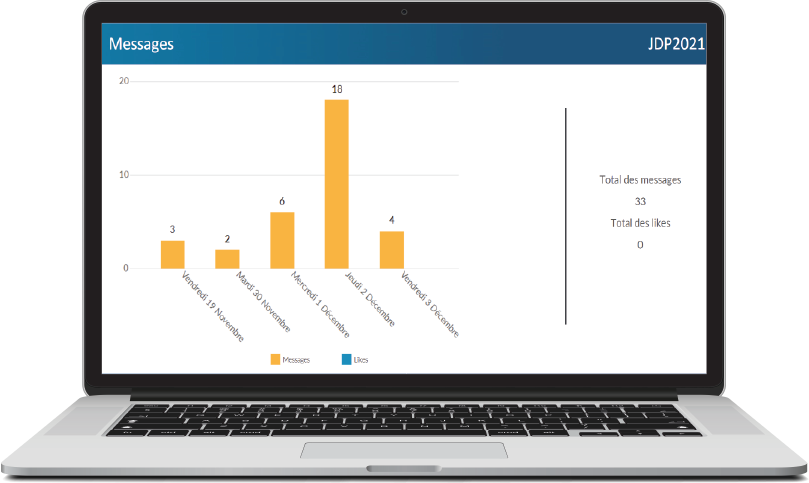
Interactive room report
The ability to analyze data is an essential component of event planning and management. One way to gauge the success of your events is to analyze the engagement of your attendees through likes, comments, and messages. With this in mind, it is essential to consult general and daily reports of messages and likes during your hybrid and onsite events.
The data provided in these reports can be filtered by day, room, and time. This feature is especially useful in determining which sessions were most engaging and what time of day is optimal for future events. For example, if a particular room consistently receives high engagement, you may want to schedule more sessions like that room during your next event.
By consulting general and daily reports of messages and likes, you can gain valuable insights into the engagement of your attendees and make informed decisions about future event planning. This information can help you create more engaging events that will attract more attendees and drive better results.
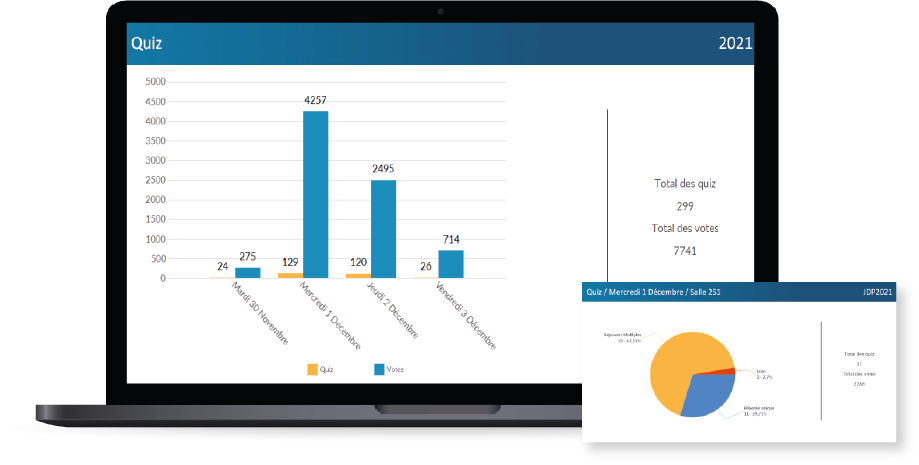
Quiz report
During your event sessions, it’s important to keep track of quiz and vote reports to understand your attendees’ engagement and gather feedback. By monitoring this data, you can make informed decisions to improve future sessions and increase attendee satisfaction.
With the quiz report, you can easily view reports by date and room. This allows you to see the level of engagement for each session and identify any trends or patterns. For example, you may notice that attendees are more engaged during morning sessions than afternoon ones.
In addition to tracking engagement, you can also use quiz and vote reports to gather feedback. This feedback can include attendees’ opinions on the session content, the speaker’s presentation style, or the event organization as a whole. By analyzing this data, you can make informed decisions about future sessions, such as adjusting the session content or finding new speakers.
Overall, monitoring quiz and vote reports during your sessions can provide valuable insights into attendee engagement and feedback. By using event software that offers these reporting tools, you can easily access and analyze this data to make informed decisions that improve the attendee experience and increase the success of your event.
Onsite Report Feature Glossary
- Fully integrated to Klipso
- Tailored to your brand
- Natively integrated
- Follow up and track audience
- User friendly
- Integrated data
- Secured to the highest standard
- UX and UI interface