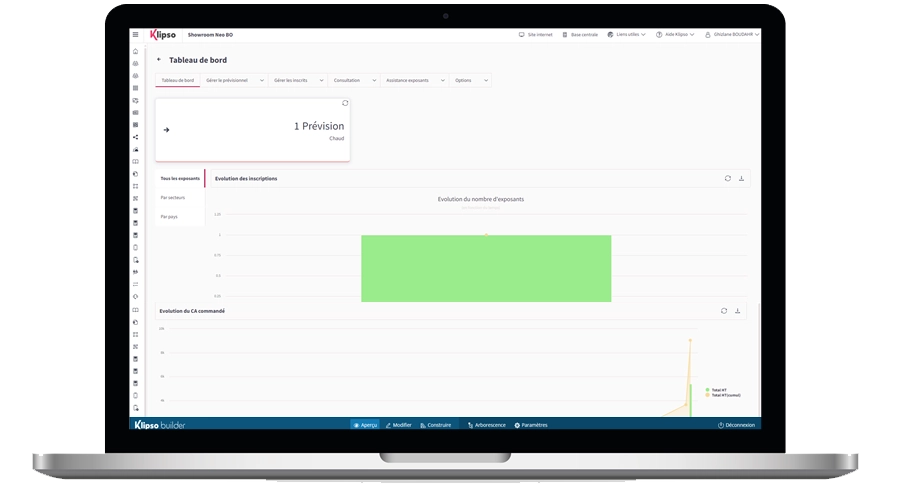
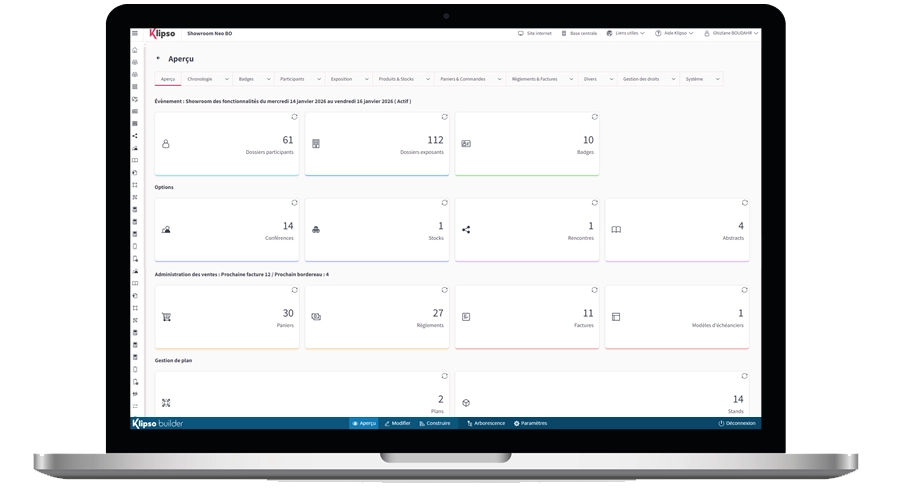
An intuitive dashboard
A global view of all the elements of your account will allow you to easily interpret the data from a multitude of entries: Commercial, administrative, technical, communication, general management, etc. You can customize your view with the elements you think are relevant.
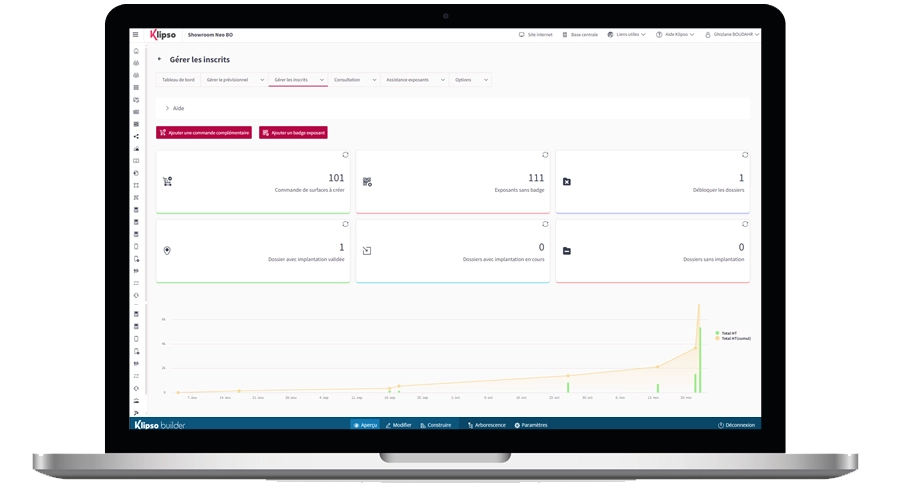
CRM report
Analyze your number of prospects and the number of forecast m² by status and by sector. Filter your reports and analyze types of funnels to understand how deals are progressing. Choose the display format : Pie chart, bars or table.
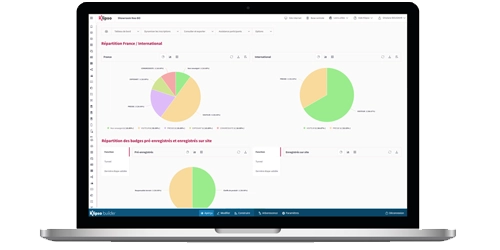
Admin report
Check the number of registrations for your onsite, virtual or hybrid event. You can display the results by sectors or by country. Control and analyze the number of exhibitors per country and display the results in bar, pie or table mode. You can export all reports.
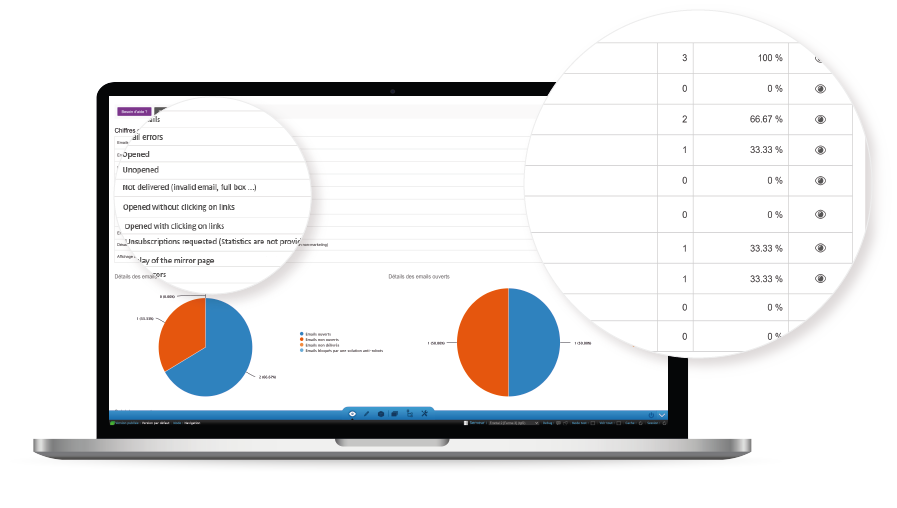
Email campaign report
Being able to measure your campaign in real time is very important for making marketing decisions. You can analyze after each submission several KPI’s such as the open rate, the click rate on each link and the conversion rate etc… Graphics are also available for a better display of the results.
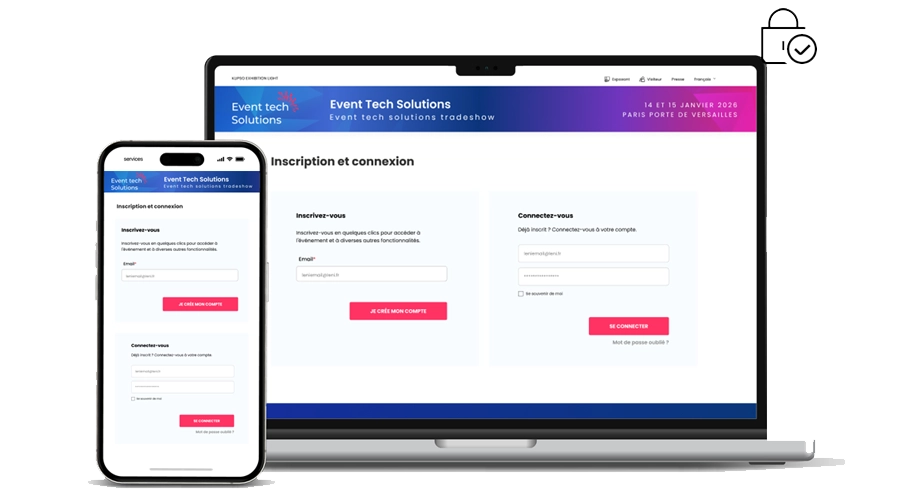
Secured data
Klipso software adopts a sophisticated infrastructure to secure all your data. Several features are implemented among them: Standard SSL Certificate, Single sign-on (SSO), memberships (to restrict access to specific web pages), etc.

Personalized reports & dashboards
Each report can be built with metrics of you choice. Choose only the KPI’s that will help you answer business questions. You can also tailor your dashboard with efficient data.
Report and Analytics Feature Glossary
- Tailored to your brand
- Easy use
- Natively integrated
- Follow up and track audience
- User friendly
- SEO friendly
- Integrated data
- Secured to the highest standard
- UI and UX design